· 7 min read
Solana Memecoin Weekly Update #4
Solana weekly meme coin update from June 19 - June 26.
Up, down, up, down. Bitcoin’s volatility this week has left traders confused and uncertain about the future of the cryptocurrency market.
Holding crypto was never meant to be easy. Luckily for you, at SolanaGeek we help make sense of this hectic market.
Ready to get started? Grab a cup of coffee, and let’s dive into the macro updates! 👇
Part 1: Macro News
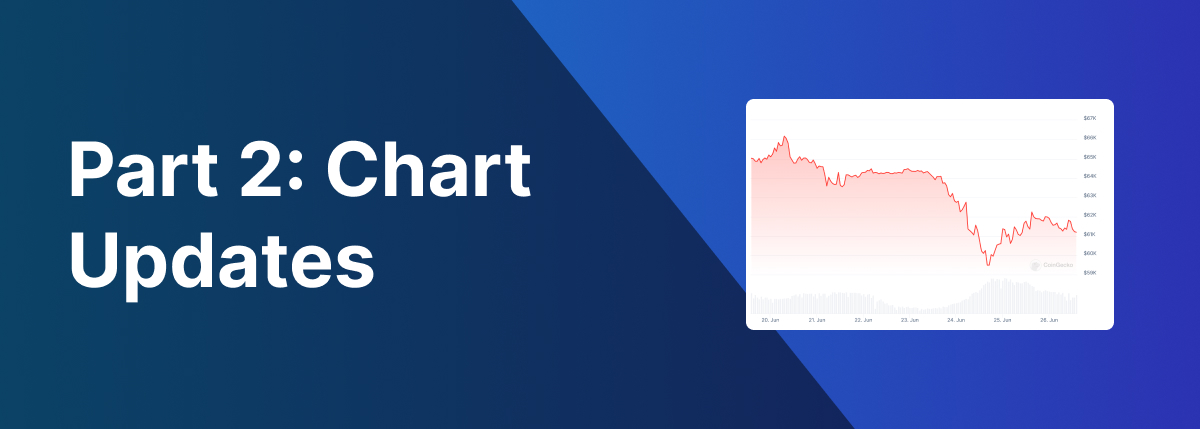
Bitcoin dropped below $59,000 for the first time since the beginning of May, before briefly bouncing back to $61,000. But what caused this mass sell-off? Let’s take a look at recent news:
Germany Government Selling
On June 25th, the German government’s wallet sold 900 Bitcoin (~$53,000,000 USD). The German government has been selling off lots of their Bitcoin recently, with 800 Bitcoin and 500 Bitcoin being sold off on June 20th and June 19th.
On top of this, their wallet still holds 46,359 Bitcoin (~$2.8 billion). The recent selling combined with the FUD of them selling more, has created a lot of negative sentiment around Bitcoin lately.
Mt. Gox Repayments
If you don’t know what Mt. Gox was, it was a Japanese cryptocurrency exchange that collapsed after being hacked in February 2014. The exchange lost around 940,000 BTC, worth $64 million at the time. They recovered 141,687 BTC ($8.5 billion) to return to its creditors. This Bitcoin will start to be paid out to creditors at the beginning of July.
This has created more FUD for Bitcoin, and will add more sell pressure in July.
Canada’s Higher Than Expected Inflation
Another notable Macro news event is Canada’s annual inflation rate accelerated to 2.9% in May compared to predictions of 2.6%. This means that another interest rate cut in Canada is unlikely in July. The FED could also use this data to delay interest rate cuts in the US.
Part 2: Chart Updates
Understanding the Charts
Indicators by Trading Alpha
- Green/Red dots: Micro bullish/bearish trend
- Green/Red candles: Macro bullish/bearish trend
- Green/Red arrows: Signals strong bullish/bearish momentum.
- Top Candles: Orange candles labeled with a T. Signal a potential local top.
- Bottom Candles: Blue candles labeled with a B. Signal a potential local bottom.
- Reversal Candles: Bullish reversal = Turquoise, Bearish reversal = Yellow
DXY - Weekly
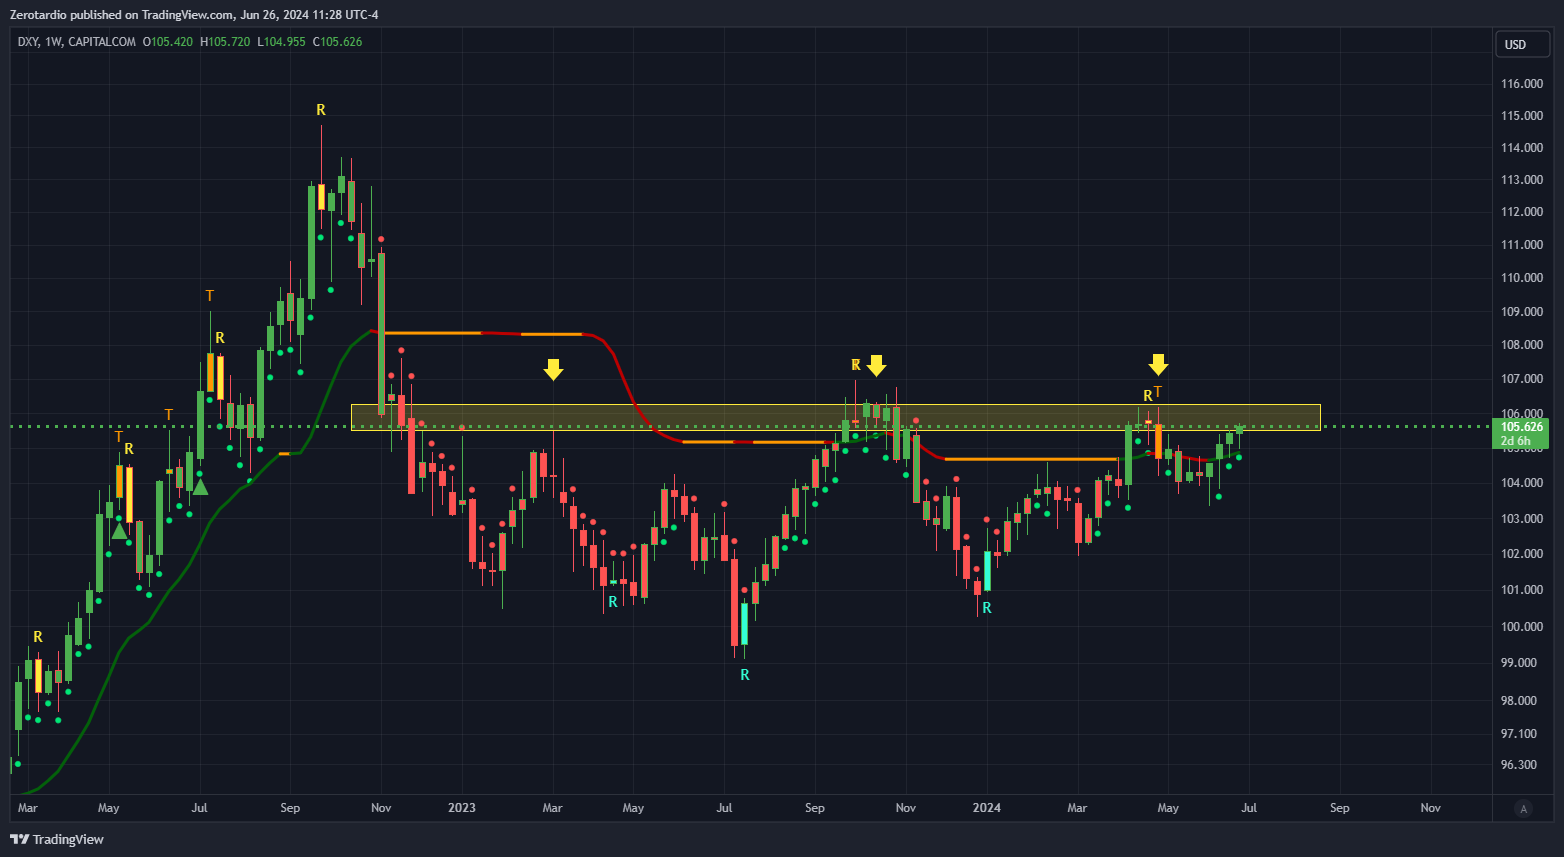
This is the chart we really want to keep our eyes on. We see that DXY tested this yellow resistance region 3 times and failed (which is bullish for BTC). We are now attempting to test it again. It’s important to note that the more times a resistance/support is tested, the more likely it is to break. If this resistance breaks, we will see further downside for the crypto markets. We must also consider the fact that if no rate cuts happen, this will send the DXY higher. It is best to wait for a clear direction on this weekly chart before committing to any large crypto positions.
BTC/USD: 8 Hour
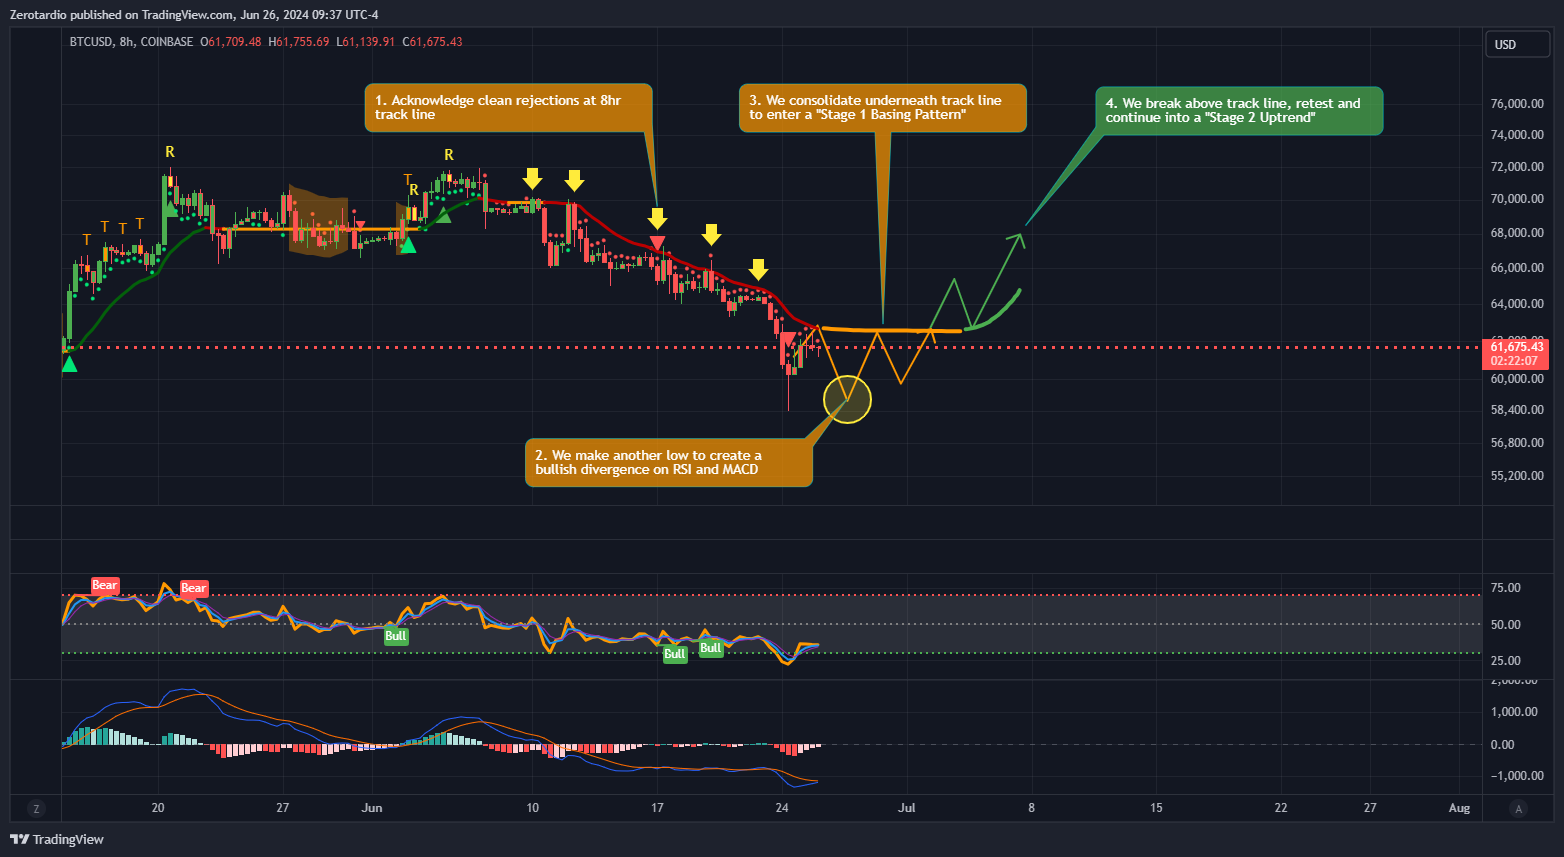
If we analyze this chart, you can see a very clear resistance on the 8 hour time frame. Every time the price tried to retest the red trackline, it got rejected. We can see it happened 5 times. Currently, it seems like we are rejecting it again, making this prediction correct so far. It’s very rare for price action to do a “V” shape correction; there is usually another test of the low which creates a bullish divergence. The higher the timeframe, the more valid the divergence is. Therefore getting it on the 8h, 12h or even daily chart would be extremely bullish.
58k was also a key level for BTC to bounce from. If we do create another low, we want to make sure the price closes above 56.5k. Otherwise, we may fall all the way down to around 52k.
Finally, we must consider the DXY chart above. If the resistance zone breaks to the upside, BTC falling to lower prices is more than likely to happen.
SOL/USD - Daily
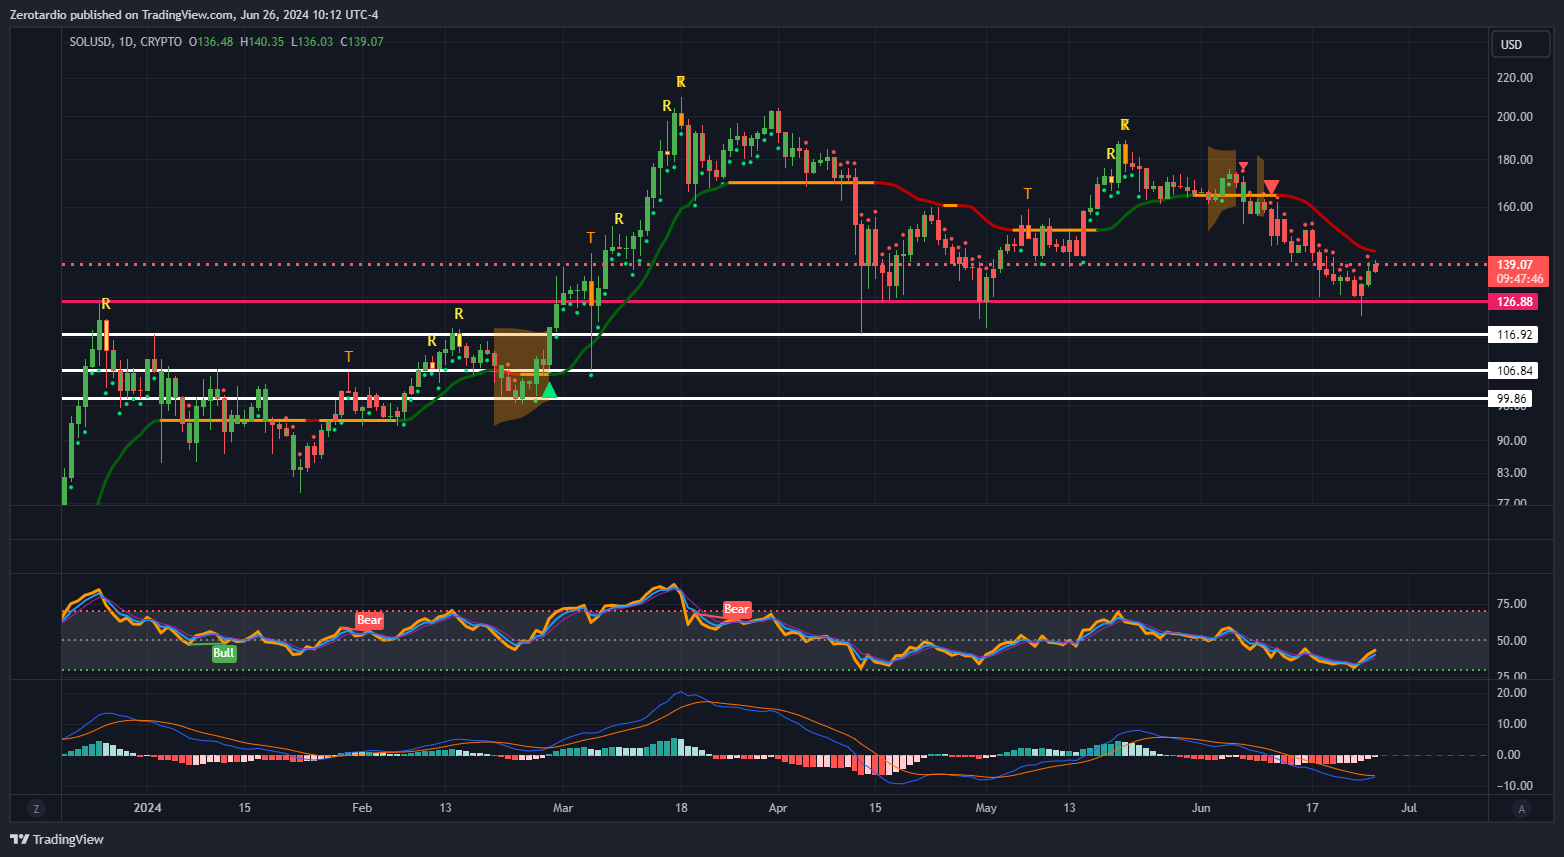
Here we can see how strong of a support the pink line was at $126.88. We can also see the MACD starting to cross to the upside. A great determination of a bullish trend flip would be to see if the MACD crosses green, we break the track line, and get green micro trend dots. Otherwise, we are looking at the white lines below as next levels of support.
ETH/USD - Daily
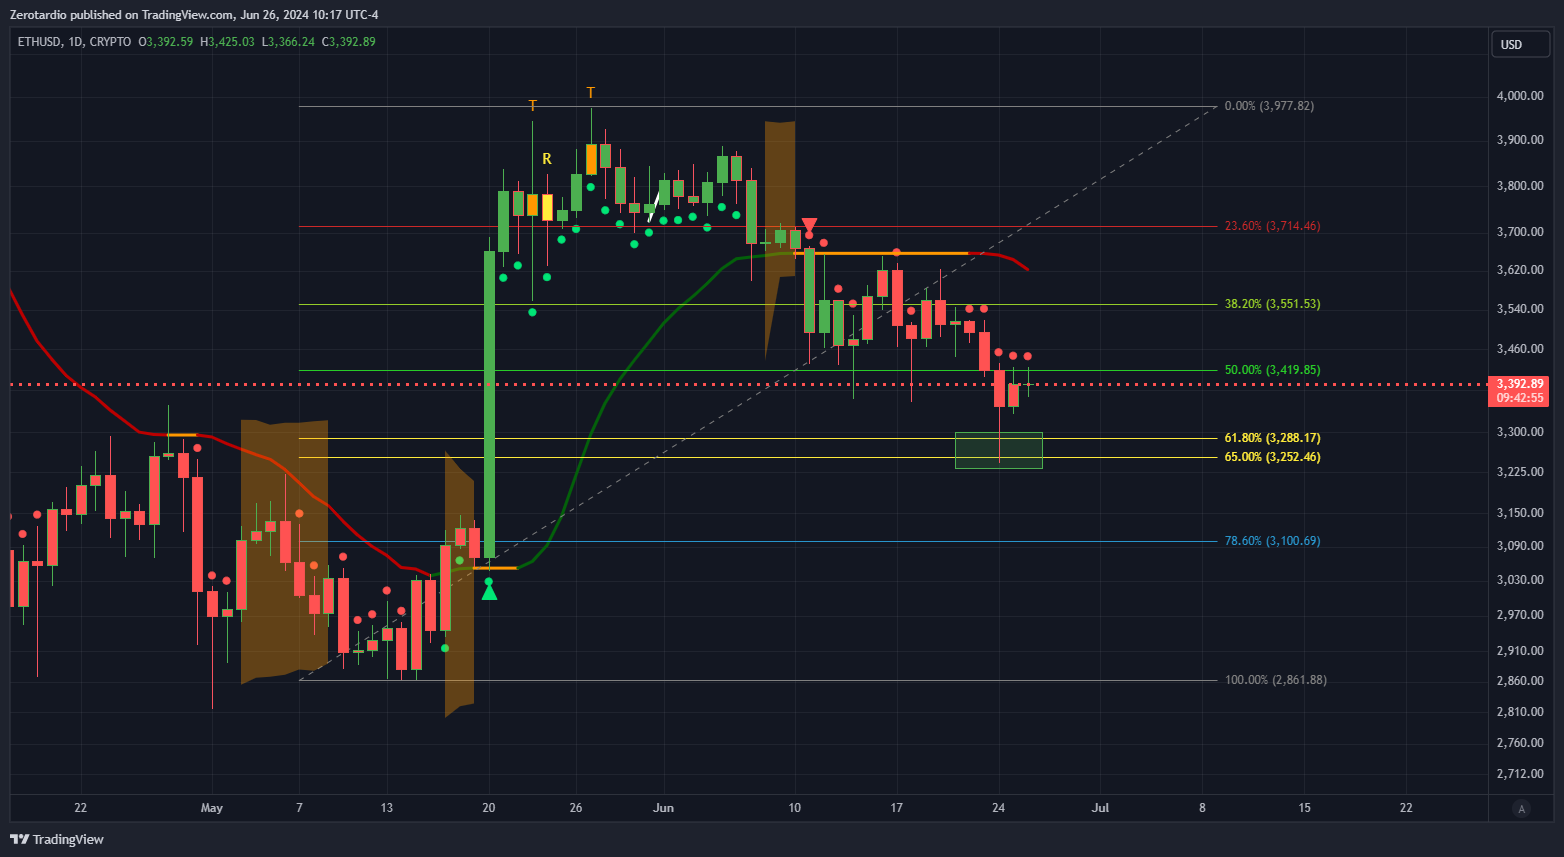
ETH has been doing better than most big caps during this dip. We can see that it bounced right off the fibonacci golden pocket. Notice how we are also very far under the red trackline. This usually indicates that we are overextended and can “snap” back towards it to retest, similar to how SOL did in the chart above. As long as BTC either consolidates or pushes upwards, this can very well be the case for ETH.
Overall Market Sentiment
The next direction of the crypto markets really all depend on DXY. If that weekly resistance range is broken to the upside, things will not look great for crypto short-mid term. Therefore our current short-term bias remains neutral as we wait for a clear direction of the US Dollar.
Part 3: Meme coin ecosystem
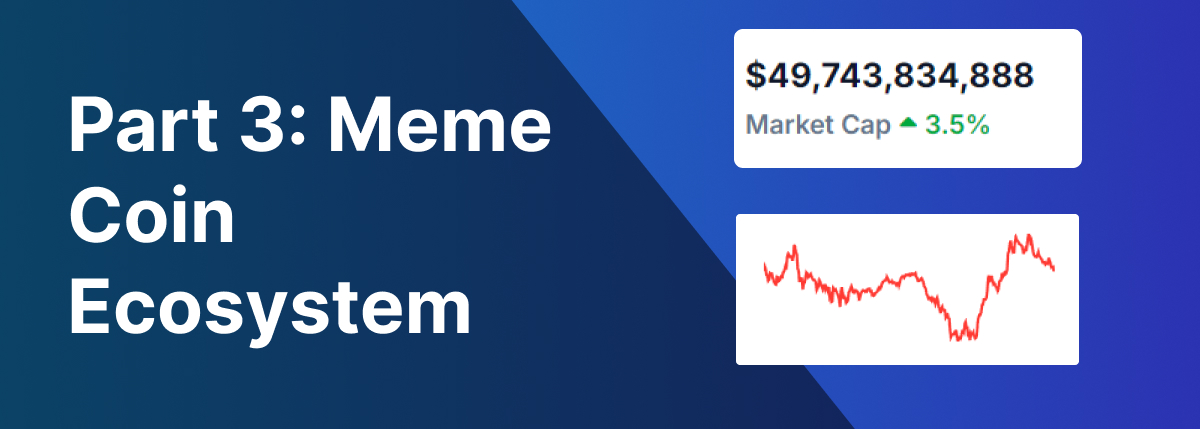
It’s been a rough couple of weeks in the world of meme coins, as we saw a mass sell off of meme coins over fears of Bitcoin going lower. The entire meme coin ecosystem market cap is currently $49 billion, up 1.3% in the last 7 days.
Due to this, we haven’t seen any good new launches this week, as meme coin holders are only holding their “safer” meme coins. I’m personally not buying any new launches, until we get a more clear direction for $btc and $sol.
Let’s take a look at the coin’s we’re going to watch this week:
Meme coins to watch
WIF
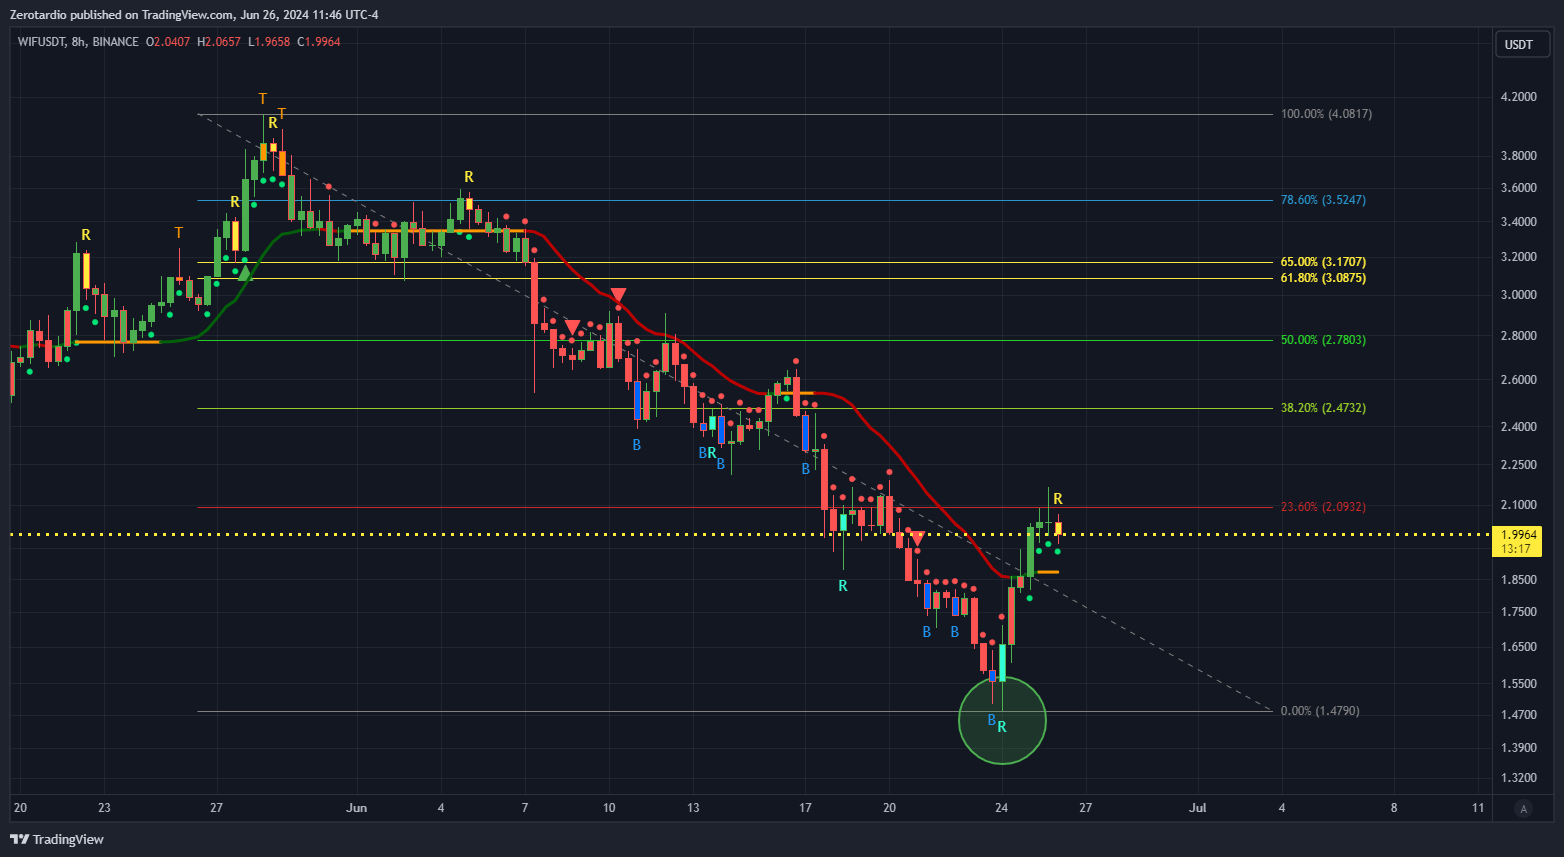
We see our first confirmed B/R combo on the 8 hour chart. The price also broke the track line and flipped green. If we draw our fibonacci retracement, we see price reversing at the 236 fib level which is a common spot for a reversal. Ideally, we want to see price make a higher low and continue upwards and test the upper fib levels.
NUB

NUB seems to be ranging between $22m-$30m market cap and playing the levels pretty well. This could be a good time to start loading up as price seems to be bottomed out. Of course this all depends on how BTC reacts to the DXY, so definitely exercise caution.
MICHI
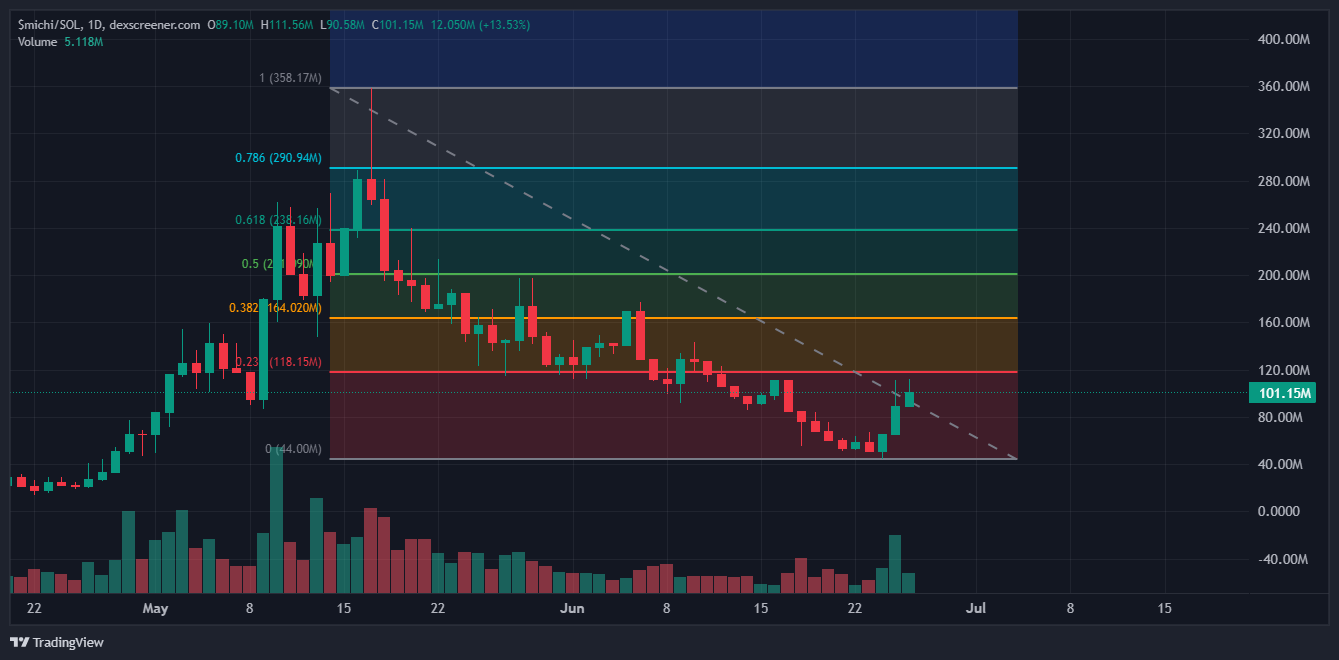
MICHI finally ended up finding a bottom and if we draw this fibonacci structure, we can see it is approaching the 236 level. This is a common spot for prices to reverse and have a normal correction. It’s best to draw this out for yourself and play level by level. As long as we create a higher low on the next dip, we are in a bullish trend.
BONK
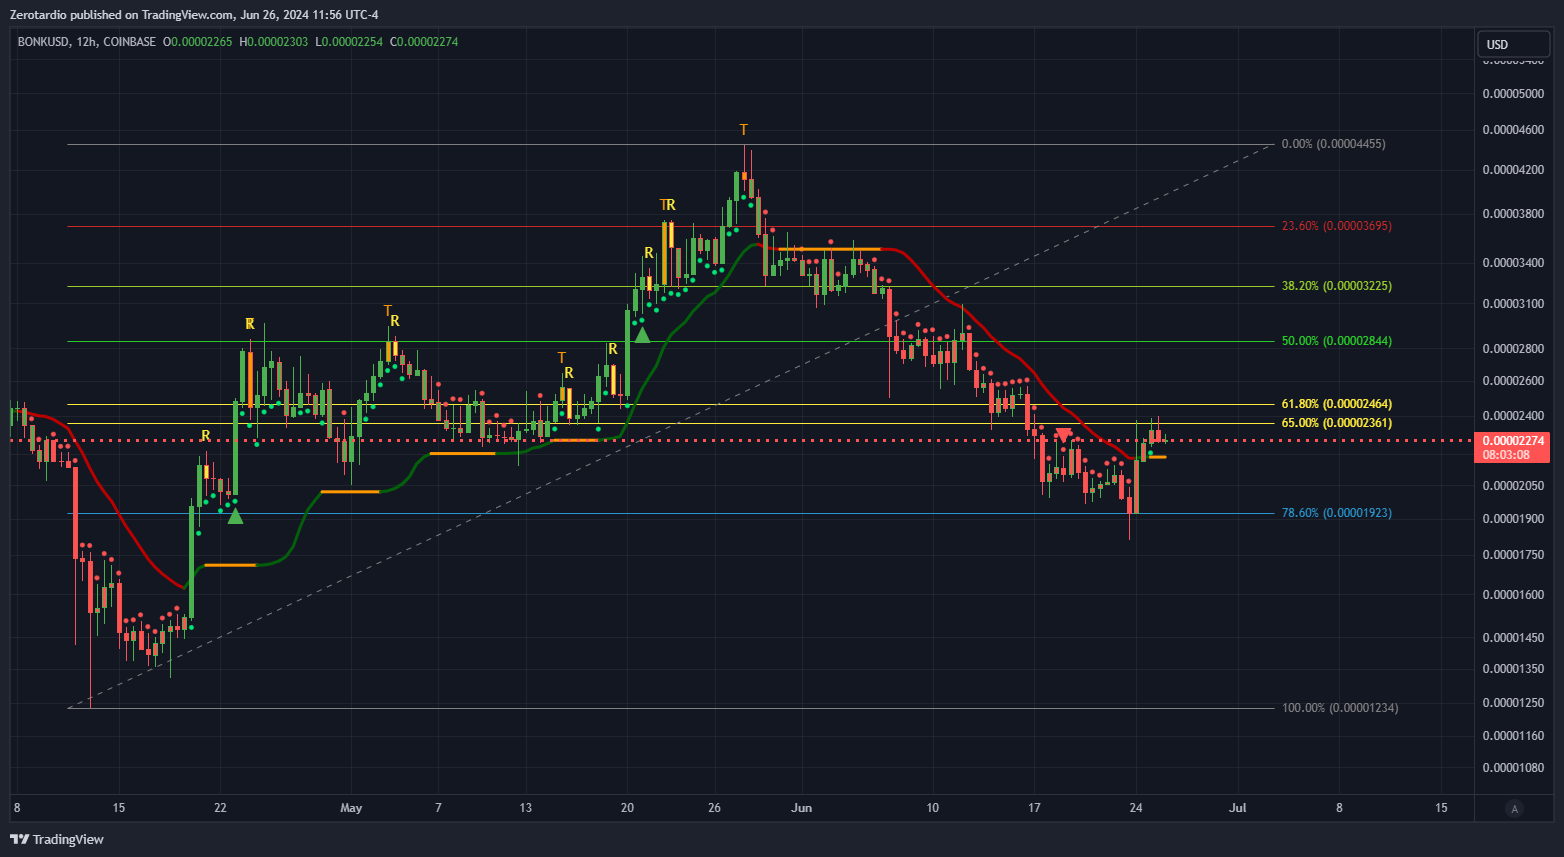
A perfect reversal off of the 786 fibonacci level. We can also see how well the 12 hour track line plays as resistance for the price. We just flipped the trackline and got our first green dot. Again, we want to see a strong continuation and higher lows in order to confirm a macro bullish structure.
PEPE
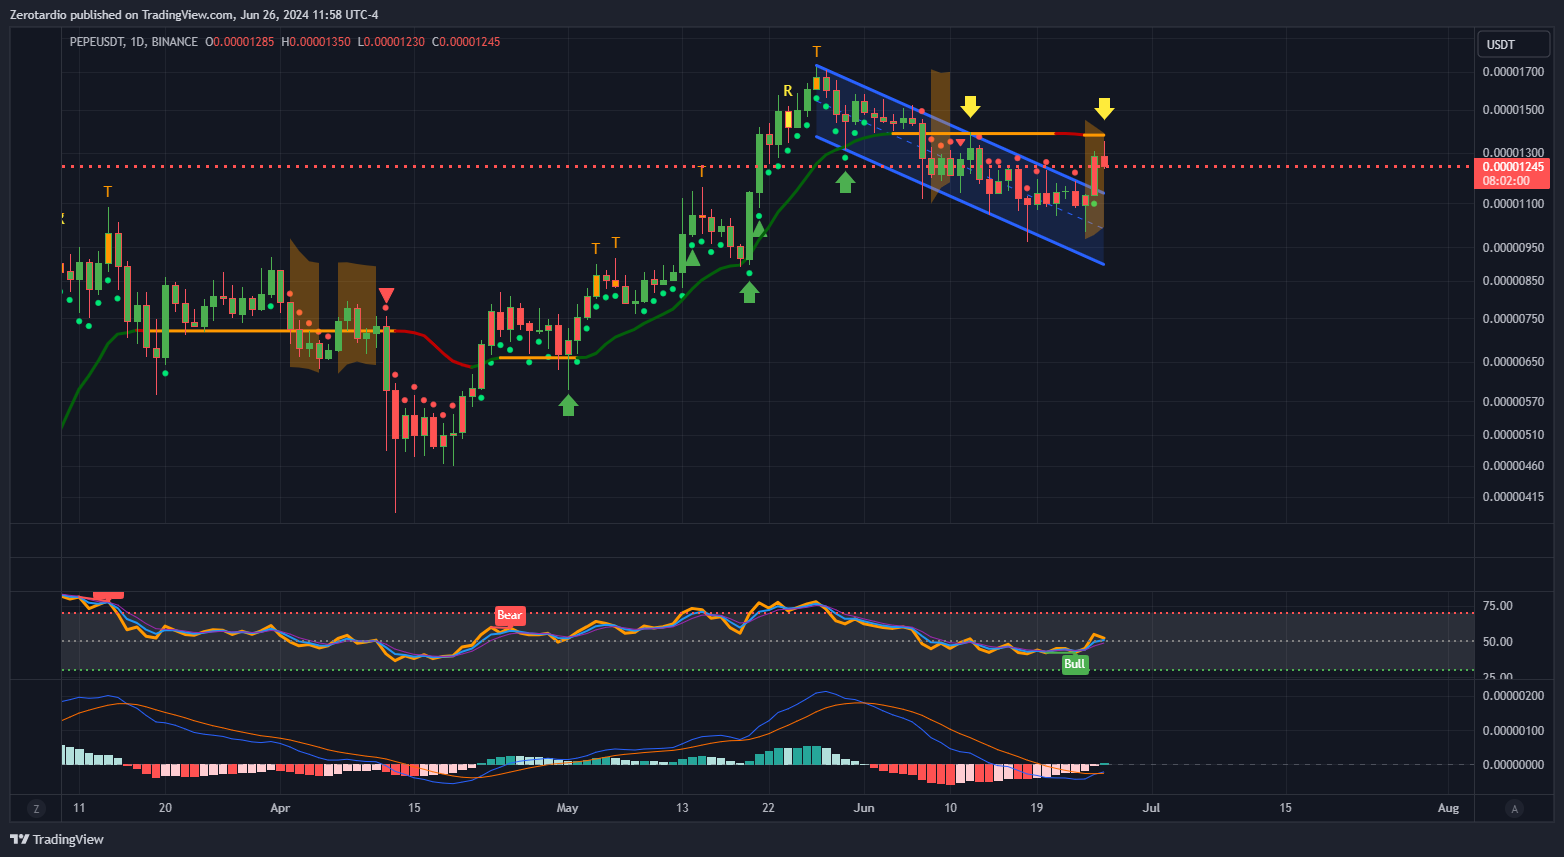
This chart is very interesting because we see PEPE made a very nice descending channel which just broke to the upside. The track line is also playing as perfect support/resistance. This may be far-fetched, but if we look at this descending channel as a bull flag pattern, we will see enormous gains from here - around 250% from current price! It’s crucial to watch how PEPE reacts to each track line retest. If it tests perfectly each time, the bull flag pattern can very well be in play.
Wrapping Things Up
In conclusion, I think we’re finally close to bottoming out before resuming the bull market. The summer is usually slow for crypto, and we should hopefully resume the bull market closer to the end of the summer. Cheers!
Disclaimer
The information provided on this blog is for educational and informational purposes only and should not be construed as financial or investment advice. We are not licensed financial advisors, and the content on this blog is not intended to be a substitute for professional financial advice.
